IoT Data Dashboard
Water Heater Sensor Dashboard
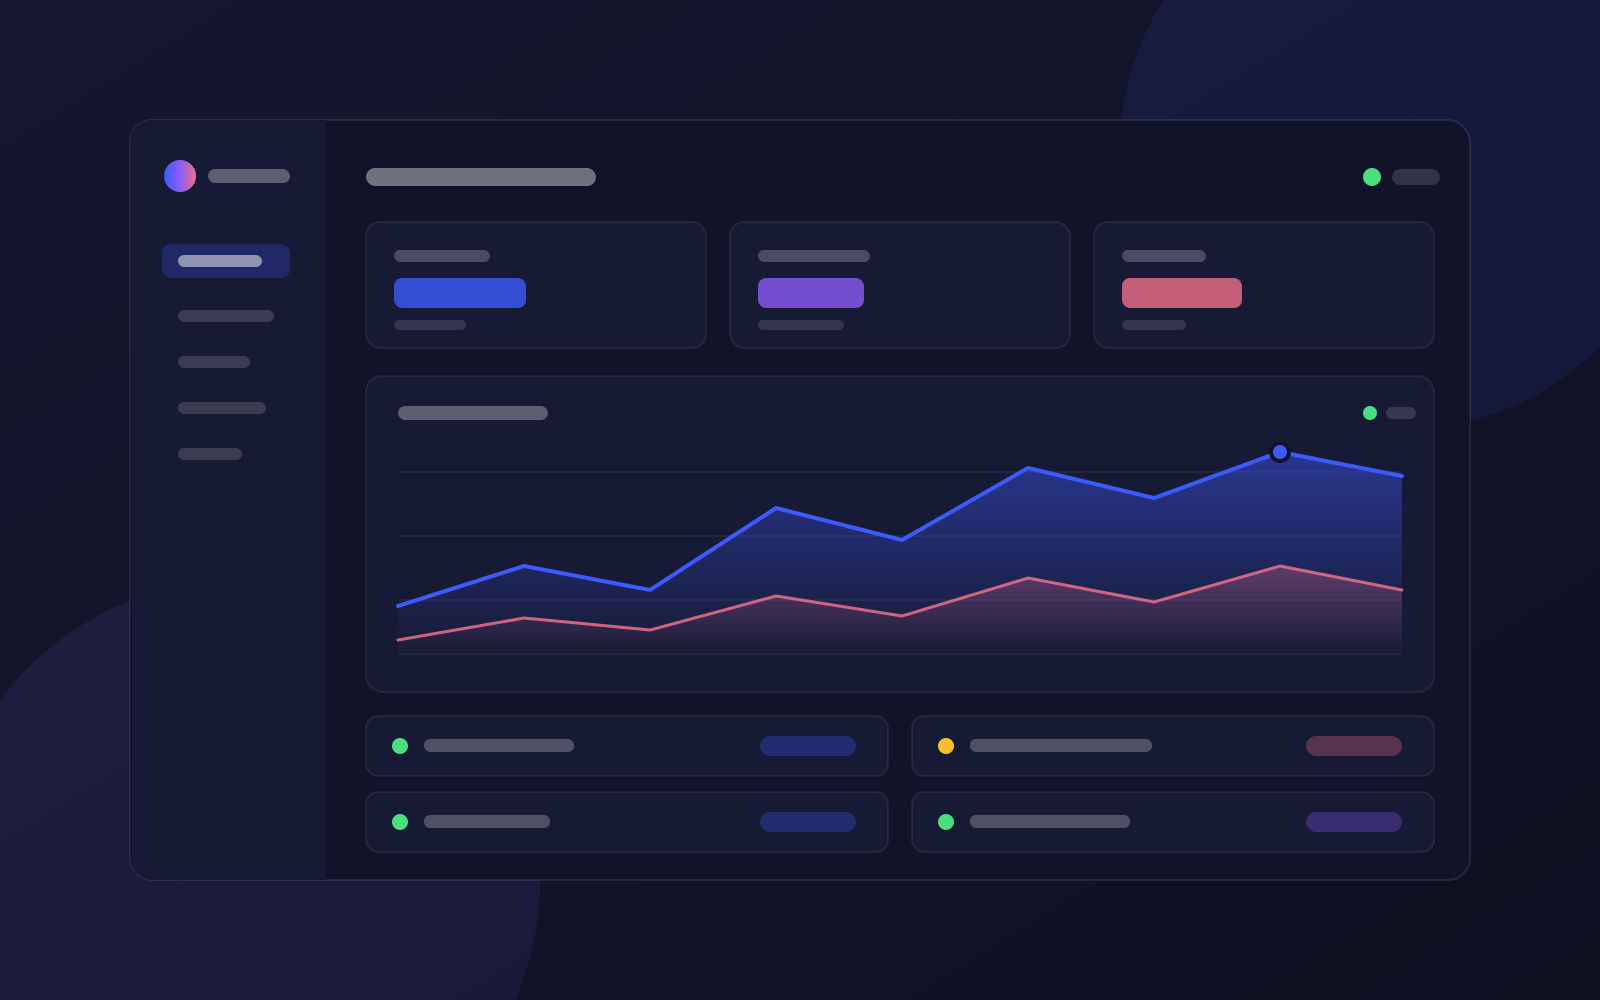
A dashboard for monitoring live sensor data from water heater units, built for internal operations use.
ReactNode.jsPostgreSQLREST APIs
Challenge
The operations team needed visibility into live sensor readings across multiple water heater units without checking each device manually.
Approach
Designed a dashboard that surfaces sensor readings in real time, prioritizing clarity and quick scanning over decoration.
Development
Built the frontend in React, with a Node.js backend exposing REST APIs and PostgreSQL storing incoming sensor readings.
Technology
React, Node.js, PostgreSQL, REST APIs.
Outcome
Delivered a working dashboard giving the team a single view of live sensor data across units.